How to Solve Core Web Vitals Failures (LCP, FID, CLS)
Fix Core Web Vitals failures with this complete guide. Learn how to optimize LCP, FID, and CLS for better rankings, user experience, and page speed.

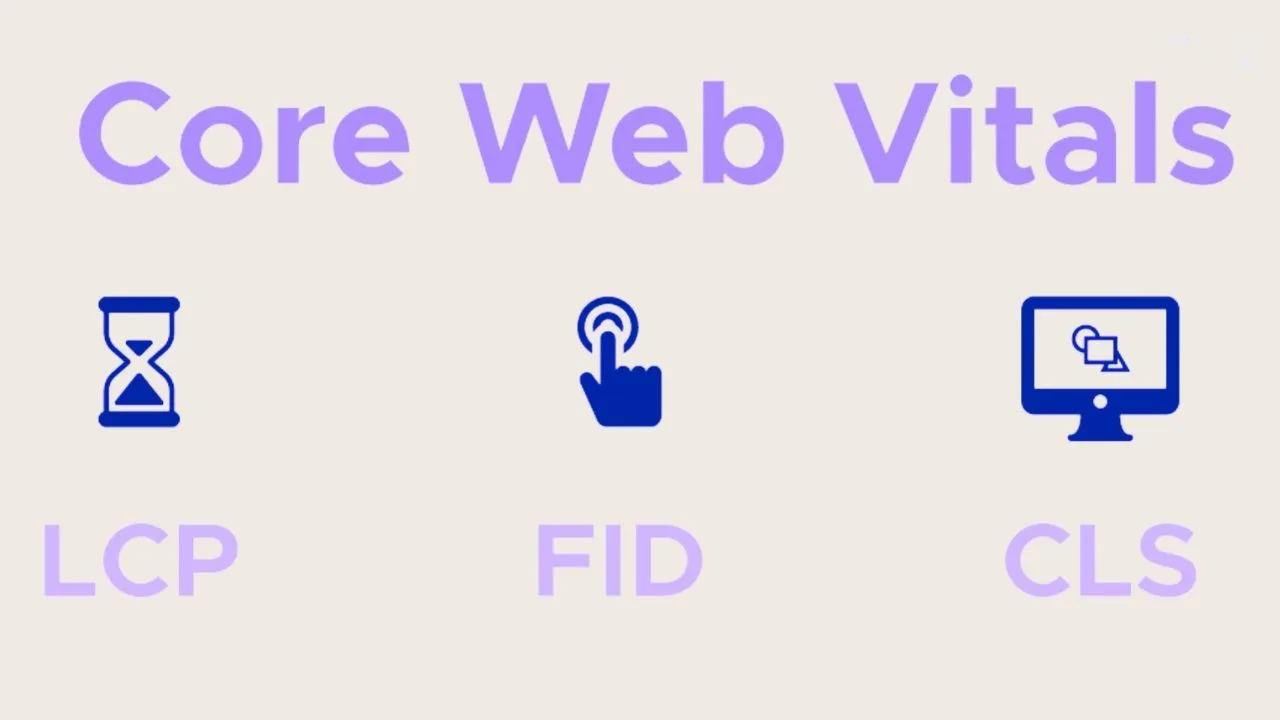
Are your Core Web Vitals failing, causing your website to lose rankings and frustrate users with slow, unstable pages? You're not alone. Since Google made Core Web Vitals a ranking factor in 2021, millions of websites have struggled to meet the performance standards required for good search visibility.
Core Web Vitals are a set of specific metrics that Google uses to measure real-world user experience on your website, focusing on loading speed, interactivity, and visual stability. According to Google's Web Vitals documentation, these metrics directly impact your search rankings and conversion rates slow pages lose both traffic and revenue.
In this comprehensive guide, I'll explain exactly what Core Web Vitals are, how to measure them, and provide proven technical solutions to fix LCP, FID, and CLS failures that are holding back your website's performance.
What Are Core Web Vitals?
Core Web Vitals are three key performance metrics Google uses to evaluate page experience:
Largest Contentful Paint (LCP): Measures loading performance how long until the largest visible element loads.
First Input Delay (FID) / Interaction to Next Paint (INP): Measures interactivity how quickly your page responds to user input.
Cumulative Layout Shift (CLS): Measures visual stability how much content shifts unexpectedly during page load.
Together, these metrics quantify critical aspects of user experience that directly impact both SEO and conversions.
Core Web Vitals Thresholds
Google categorizes performance into three levels:
| Metric | Good | Needs Improvement | Poor |
| LCP | ≤ 2.5s | 2.5s - 4.0s | > 4.0s |
| FID | ≤ 100ms | 100ms - 300ms | > 300ms |
| INP | ≤ 200ms | 200ms - 500ms | > 500ms |
| CLS | ≤ 0.1 | 0.1 - 0.25 | > 0.25 |
Note: Google is phasing out FID in favor of INP (Interaction to Next Paint) as a more comprehensive interactivity metric. Both are currently monitored, but INP will become the official ranking factor.
Why Core Web Vitals Matter
SEO Impact:
- Direct ranking factor since June 2021
- Pages with good Core Web Vitals get ranking preference
- Mobile-first indexing emphasizes mobile performance
- Poor vitals can cost you first-page rankings
Business Impact:
- 1 second delay in load time = 7% reduction in conversions
- 53% of mobile users abandon pages taking over 3 seconds
- Every 100ms improvement in LCP increases conversion by 1%
- Better CLS reduces user frustration and accidental clicks
Learn more about technical SEO fundamentals in my technical SEO checklist.
How to Measure Core Web Vitals
Before fixing issues, you need accurate measurements.
Field Data (Real User Metrics)
Google Search Console:
- Most important data source (Google's actual ranking data)
- Shows Core Web Vitals report for mobile and desktop
- Groups URLs by status (Good, Needs Improvement, Poor)
- Provides example URLs for each issue type
Chrome User Experience Report (CrUX):
- Real user data from Chrome browsers
- Powers PageSpeed Insights and Search Console
- Requires at least 1,000 visits in 28 days for data
- Most accurate reflection of user experience
PageSpeed Insights:
- Combines field data (CrUX) with lab testing
- Tests specific URLs on demand
- Provides detailed diagnostics and recommendations
- Free tool: https://pagespeed.web.dev/
Lab Data (Simulated Testing)
Lighthouse:
- Built into Chrome DevTools
- Simulates performance on specific device/network
- Provides detailed breakdown and optimization suggestions
- Consistent testing environment
WebPageTest:
- Advanced testing with multiple locations and devices
- Video playback of page loading
- Waterfall charts showing all resources
- Free tool: https://www.webpagetest.org/
Chrome DevTools:
- Performance panel for detailed analysis
- Network throttling to simulate slow connections
- Coverage tool to find unused CSS/JS
- Real-time monitoring during development
Recommended Measurement Strategy
- Start with Search Console: Identify which pages fail Core Web Vitals
- Use PageSpeed Insights: Test specific failing URLs
- Analyze with Lighthouse: Get detailed diagnostics
- Deep dive with DevTools: Find specific bottlenecks
- Monitor with CrUX: Track real user improvements over time
Find more useful tools in my SEO tools guide.
Understanding and Fixing LCP (Largest Contentful Paint)
LCP measures how long it takes for the largest visible content element to load. This is typically your main hero image, headline, or primary content block.
What Counts as LCP Element
Common LCP elements:
- Large hero images
- Background images
- Video thumbnails or posters
- Large text blocks
- Image carousels (first slide)
Common LCP Problems
Problem #1: Slow Server Response Time (TTFB)
Diagnosis: Check Time to First Byte in PageSpeed Insights or WebPageTest.
Solutions:
A. Upgrade Hosting:
- Move from shared to VPS or dedicated hosting
- Use managed WordPress hosting (WP Engine, Kinsta, Flywheel)
- Choose hosting with server locations near your audience
B. Implement Server-Side Caching:
// WordPress: Install caching plugin
// Recommended: WP Rocket, W3 Total Cache, LiteSpeed Cache
C. Use a CDN:
- Cloudflare (free tier available)
- AWS CloudFront
- Fastly
- BunnyCDN
D. Optimize Database:
-- Clean up WordPress database
OPTIMIZE TABLE wp_posts;
OPTIMIZE TABLE wp_postmeta;
OPTIMIZE TABLE wp_options;
E. Enable HTTP/2 or HTTP/3: Most modern hosting supports this automatically with SSL.
Problem #2: Render-Blocking Resources
Diagnosis: Look for "Eliminate render-blocking resources" in PageSpeed Insights.
Solutions:
A. Defer Non-Critical JavaScript:
<!-- Defer JavaScript -->
<script src="script.js" defer></script>
<!-- For non-essential scripts, use async -->
<script src="analytics.js" async></script>
B. Inline Critical CSS: Extract CSS needed for above-the-fold content and inline it:
<head>
<style>
/* Critical CSS here */
.header { /* styles */ }
.hero { /* styles */ }
</style>
<link rel="stylesheet" href="full-styles.css" media="print" onload="this.media='all'">
</head>
C. Preload Key Resources:
<link rel="preload" href="hero-image.jpg" as="image">
<link rel="preload" href="main-font.woff2" as="font" type="font/woff2" crossorigin>
D. Remove Unused CSS/JavaScript: Use Chrome DevTools Coverage tool to identify unused code, then remove it or split it into separate files.
Problem #3: Large Images
Diagnosis: Check image sizes in Network tab of DevTools.
Solutions:
A. Compress Images:
- Use WebP format (70-90% smaller than JPEG)
- Compress with TinyPNG, Squoosh, or ImageOptim
- Target: Hero images under 200KB
B. Implement Responsive Images:
<picture>
<source media="(max-width: 600px)" srcset="hero-mobile.webp" type="image/webp">
<source media="(max-width: 600px)" srcset="hero-mobile.jpg">
<source srcset="hero-desktop.webp" type="image/webp">
<img src="hero-desktop.jpg" alt="Hero Image" width="1200" height="600">
</picture>
C. Lazy Load Below-the-Fold Images:
<!-- Native lazy loading -->
<img src="image.jpg" loading="lazy" alt="Description">
Important: NEVER lazy load the LCP image. It must load immediately.
D. Optimize Image Delivery:
- Use image CDN (Cloudinary, Imgix)
- Serve from CDN with compression
- Enable auto format conversion
E. Set Image Dimensions:
<!-- Always specify width and height -->
<img src="hero.jpg" alt="Hero" width="1200" height="600">
This prevents layout shifts and helps browser allocate space before image loads.
Problem #4: Large Resource Files
Diagnosis: Check bundle sizes in Network tab.
Solutions:
A. Minify CSS/JavaScript:
- Use build tools (Webpack, Parcel, Vite)
- Enable minification in WordPress plugins
- Remove comments and whitespace
B. Code Splitting:
// Load components only when needed
import(/* webpackChunkName: "heavy-component" */ './HeavyComponent')
.then(module => {
// Use component
});
C. Tree Shaking: Remove unused code from bundles automatically with modern build tools.
D. Reduce Dependencies:
- Audit npm packages with npm ls
- Remove unnecessary libraries
- Replace heavy libraries with lighter alternatives
For e-commerce sites, see my e-commerce SEO tips for specific optimization strategies.
Problem #5: Client-Side Rendering
Diagnosis: View page source if critical content loads via JavaScript, you have CSR issues.
Solutions:
A. Implement Server-Side Rendering (SSR):
- Use Next.js for React apps
- Use Nuxt.js for Vue apps
- Use Angular Universal for Angular apps
B. Static Site Generation (SSG):
- Pre-render pages at build time
- Use Gatsby, Next.js, or Hugo
- Serves fully-rendered HTML immediately
C. Hybrid Approach:
- SSR for above-the-fold content
- Client-side render for interactive features below fold
Understanding and Fixing FID/INP (Interactivity)
FID measures the delay between user interaction and browser response. INP measures the overall responsiveness throughout page lifecycle.
Common FID/INP Problems
Problem #1: Heavy JavaScript Execution
Diagnosis: Check "Total Blocking Time" in Lighthouse.
Solutions:
A. Break Up Long Tasks:
// Bad: Long synchronous task
function processHugeArray(array) {
array.forEach(item => heavyProcess(item));
}
// Good: Break into chunks
async function processHugeArray(array) {
for (let i = 0; i < array.length; i += 100) {
await new Promise(resolve => setTimeout(resolve, 0));
array.slice(i, i + 100).forEach(item => heavyProcess(item));
}
}
B. Use Web Workers: Move heavy computations off main thread:
// worker.js
self.addEventListener('message', function(e) {
const result = heavyComputation(e.data);
self.postMessage(result);
});
// main.js
const worker = new Worker('worker.js');
worker.postMessage(data);
worker.onmessage = function(e) {
console.log('Result:', e.data);
};
C. Defer Third-Party Scripts:
<!-- Load analytics, ads, etc. after page is interactive -->
<script src="third-party.js" defer></script>
Problem #2: Unoptimized Event Listeners
Diagnosis: Check for excessive event listeners in DevTools Performance panel.
Solutions:
A. Debounce/Throttle Events:
// Debounce scroll events
function debounce(func, wait) {
let timeout;
return function executedFunction(...args) {
clearTimeout(timeout);
timeout = setTimeout(() => func(...args), wait);
};
}
window.addEventListener('scroll', debounce(() => {
// Handle scroll
}, 100));
B. Use Passive Listeners:
// Improves scroll performance
element.addEventListener('touchstart', handler, { passive: true });
C. Remove Unused Listeners: Clean up event listeners when no longer needed to prevent memory leaks.
Problem #3: Large DOM Size
Diagnosis: Lighthouse reports "Avoid an excessive DOM size."
Solutions:
A. Reduce DOM Nodes:
- Target: Under 1,500 nodes
- Maximum: 800 nodes depth
- Simplify HTML structure
B. Lazy Render Components: Only render visible components:
// React example with Intersection Observer
import { useInView } from 'react-intersection-observer';
function HeavyComponent() {
const { ref, inView } = useInView({ triggerOnce: true });
return (
<div ref={ref}>
{inView ? <ActualComponent /> : <Placeholder />}
</div>
);
}
C. Virtualize Long Lists: Use virtual scrolling for long lists (React Window, Vue Virtual Scroller).
Problem #4: Inefficient Polyfills
Diagnosis: Check if you're loading unnecessary polyfills for modern browsers.
Solutions:
A. Conditional Polyfill Loading:
<script nomodule src="polyfills.js"></script>
<script type="module" src="modern.js"></script>
B. Use Differential Loading: Serve modern code to modern browsers, legacy code to old browsers.
Understanding and Fixing CLS (Cumulative Layout Shift)
CLS measures visual stability how much content shifts unexpectedly during page load.
Common CLS Problems
Problem #1: Images Without Dimensions
Diagnosis: Images loading cause content below to shift down.
Solutions:
Always Specify Width and Height:
<!-- Bad: No dimensions -->
<img src="image.jpg" alt="Photo">
<!-- Good: With dimensions -->
<img src="image.jpg" alt="Photo" width="800" height="600">
<!-- Modern CSS approach -->
<style>
img {
aspect-ratio: 16 / 9;
width: 100%;
height: auto;
}
</style>
<img src="image.jpg" alt="Photo">
Problem #2: Ads and Embeds Without Reserved Space
Diagnosis: Ads loading push content down significantly.
Solutions:
A. Reserve Space for Ads:
<div style="min-height: 250px;">
<!-- Ad code here -->
</div>
B. Use CSS Aspect Ratio:
.ad-container {
aspect-ratio: 300 / 250;
width: 100%;
}
C. Load Ads After Main Content: Delay ad loading until page is stable.
Problem #3: Web Fonts Causing Layout Shift
Diagnosis: Text reflows when web fonts load.
Solutions:
A. Use font-display: swap:
@font-face {
font-family: 'CustomFont';
src: url('font.woff2') format('woff2');
font-display: swap; /* Show fallback immediately, swap when loaded */
}
B. Preload Critical Fonts:
<link rel="preload" href="font.woff2" as="font" type="font/woff2" crossorigin>
C. Match Fallback Font Metrics: Use tools like Fontaine or Capsize to match fallback font size to web font size, minimizing shift.
Problem #4: Dynamically Injected Content
Diagnosis: Content added via JavaScript causes shifts.
Solutions:
A. Reserve Space:
.dynamic-content {
min-height: 200px; /* Reserve approximate space */
}
B. Load Above the Fold First: Inject dynamic content below the fold or after initial render.
C. Use Transform Instead of Top/Left:
/* Bad: Causes layout shift */
.element {
top: 100px;
}
/* Good: No layout shift */
.element {
transform: translateY(100px);
}
Problem #5: Animations Causing Shifts
Diagnosis: CSS animations or transitions affecting layout.
Solutions:
Use Transform and Opacity:
/* Bad: Affects layout */
.element {
width: 100px;
transition: width 0.3s;
}
.element:hover {
width: 200px;
}
/* Good: No layout impact */
.element {
transform: scale(1);
transition: transform 0.3s;
}
.element:hover {
transform: scale(2);
}
Properties that DON'T cause layout shift:
- transform
- opacity
- filter
Properties that DO cause layout shift:
- width, height
- top, left, bottom, right
- margin, padding
Learn more about performance optimization in my technical SEO guide.
WordPress-Specific Optimizations
If you're running WordPress, these plugins and techniques help significantly:
Recommended Performance Plugins
| Plugin | Best For | Key Features |
| WP Rocket | Overall performance | Caching, minification, lazy loading, CDN |
| NitroPack | All-in-one solution | Automatic optimization, built-in CDN |
| Perfmatters | Advanced users | Granular control, script management |
| Autoptimize | Free alternative | CSS/JS optimization, image lazy loading |
| ShortPixel | Image optimization | WebP conversion, compression, lazy load |
WordPress Optimization Steps
1. Remove Unnecessary Plugins: Each plugin adds overhead. Audit and remove unused plugins.
2. Choose Lightweight Theme:
- GeneratePress
- Astra
- Kadence
Avoid heavy page builders like Elementor if possible.
3. Disable Unused WordPress Features:
// In functions.php
// Disable emojis
remove_action('wp_head', 'print_emoji_detection_script', 7);
remove_action('wp_print_styles', 'print_emoji_styles');
// Disable embeds
function disable_embeds() {
wp_deregister_script('wp-embed');
}
add_action('wp_footer', 'disable_embeds');
4. Optimize Database: Use plugins like WP-Optimize to clean revisions, spam, and transients.
5. Implement Object Caching: Use Redis or Memcached for database query caching.
Mobile-Specific Optimizations
Mobile Core Web Vitals are especially important with mobile-first indexing.
Mobile Optimization Strategies
1. Reduce Mobile Payload:
- Serve smaller images to mobile devices
- Remove unnecessary features on mobile
- Simplify navigation
2. Optimize Touch Targets:
/* Ensure tap targets are at least 48x48px */
button, a {
min-width: 48px;
min-height: 48px;
}
3. Use Responsive Images: Serve appropriate image sizes based on screen size.
4. Test on Real Devices: Use Chrome DevTools device simulation, but also test on actual mobile devices.
5. Optimize for Slow Networks: Test with "Slow 3G" throttling enabled in DevTools.
For local businesses, see my local SEO services guide for mobile optimization specifics.
Monitoring and Maintaining Core Web Vitals
Optimization is ongoing, not one-time.
Set Up Monitoring
Google Search Console:
- Check Core Web Vitals report weekly
- Set up email alerts for new issues
- Monitor trend lines for improvements
Real User Monitoring (RUM):
- Implement RUM with tools like SpeedCurve or Calibre
- Track actual user metrics continuously
- Alert on regressions
Lighthouse CI:
- Integrate Lighthouse into CI/CD pipeline
- Prevent performance regressions before deployment
- Set performance budgets
Performance Budget
Set maximum thresholds:
{
"lcp": 2500,
"fid": 100,
"cls": 0.1,
"totalPageSize": 2000000,
"imageSize": 800000,
"scriptSize": 400000
}
Regular Audits
Schedule systematic reviews:
- Weekly: Search Console Core Web Vitals report
- Monthly: Full Lighthouse audit of key pages
- Quarterly: Comprehensive SEO audit including performance
Real-World Core Web Vitals Improvements
Here are actual results from Core Web Vitals optimization projects:
Case Study #1: E-Commerce Site
- Before: LCP 4.8s, CLS 0.42, FID 285ms
- Actions: Optimized images (WebP), implemented CDN, deferred JS, fixed ad layouts
- After: LCP 2.1s, CLS 0.06, FID 68ms
- Result: 28% increase in organic traffic, 34% improvement in conversion rate
Case Study #2: Blog/Publisher
- Before: LCP 5.2s (hero images), CLS 0.38 (ads)
- Actions: Lazy loading, reserved ad space, preloaded fonts, server upgrade
- After: LCP 2.3s, CLS 0.08
- Result: 45% traffic increase, reduced bounce rate from 68% to 42%
Case Study #3: Local Service Business
- Before: Mobile LCP 6.1s, CLS 0.51
- Actions: Mobile image optimization, removed unnecessary plugins, enabled caching
- After: LCP 2.4s, CLS 0.09
- Result: 89% increase in mobile organic traffic, improved local rankings
View more success stories in my case studies.
Advanced Core Web Vitals Optimization
For sites still struggling after basic optimizations:
Edge Computing
Use edge functions to:
- Optimize images at the edge
- Serve personalized content faster
- Reduce server response time
Platforms: Cloudflare Workers, Vercel Edge Functions, AWS Lambda@Edge
Progressive Web App (PWA)
Implement PWA features:
- Service workers for caching
- Offline functionality
- Instant loading for repeat visits
Critical Rendering Path Optimization
1. Minimize Critical Resources: Only load what's needed for above-the-fold rendering.
2. Minimize Critical Bytes: Reduce size of critical resources.
3. Minimize Critical Round Trips: Reduce number of server requests needed for initial render.
Resource Hints
<!-- DNS prefetch for external domains -->
<link rel="dns-prefetch" href="https://external-site.com">
<!-- Preconnect for high-priority connections -->
<link rel="preconnect" href="https://fonts.googleapis.com">
<!-- Prefetch resources for next navigation -->
<link rel="prefetch" href="next-page.html">
Common Core Web Vitals Mistakes
Avoid these errors that waste optimization efforts:
Mistake #1: Optimizing Lab Scores Instead of Field Data
Problem: Achieving perfect Lighthouse scores but real users still experience poor vitals.
Solution: Focus on CrUX/Search Console data it's what Google uses for rankings.
Mistake #2: Over-Optimization
Problem: Breaking functionality to chase perfect scores.
Solution: Balance performance with functionality. 95/100 is often enough.
Mistake #3: Ignoring Mobile
Problem: Optimizing desktop while mobile fails Core Web Vitals.
Solution: Mobile-first optimization test and fix mobile first.
Mistake #4: Not Testing on Real Devices
Problem: Simulator shows good scores, real devices struggle.
Solution: Test on actual mobile devices with throttled networks.
Mistake #5: Fixing Symptoms Not Causes
Problem: Applying quick fixes without addressing root issues.
Solution: Understand why problems occur, fix underlying causes.
When to Hire a Performance Expert
Consider professional help when:
- Core Web Vitals significantly impact rankings/traffic
- Multiple failed optimization attempts
- Complex technical stack requiring specialized knowledge
- Lack of in-house development resources
- Need comprehensive technical SEO services
As an experienced technical SEO specialist, I've helped dozens of websites pass Core Web Vitals and improve their search rankings and user experience.
Conclusion: Achieve Good Core Web Vitals
Core Web Vitals are critical for both SEO and user experience. While achieving good scores requires technical work, the benefits better rankings, lower bounce rates, higher conversions make the effort worthwhile.
Action Plan:
- Measure current performance in Google Search Console
- Test failing URLs with PageSpeed Insights and Lighthouse
- Fix LCP by optimizing images, reducing server response time, eliminating render-blocking resources
- Fix FID/INP by reducing JavaScript execution time, breaking up long tasks
- Fix CLS by specifying image dimensions, reserving space for ads, optimizing font loading
- Monitor improvements in Search Console over 28 days
- Implement ongoing performance monitoring
Remember that Core Web Vitals optimization is iterative. Start with the biggest issues, measure results, and continue refining.
Need Help Fixing Core Web Vitals?
If you're struggling with Core Web Vitals failures or need expert assistance optimizing your website's performance, I can help. With extensive experience improving Core Web Vitals across various platforms and industries, I'll:
- Conduct comprehensive performance audits
- Identify specific bottlenecks causing failures
- Implement technical fixes for LCP, FID/INP, and CLS
- Optimize for both mobile and desktop
- Monitor improvements and prevent regressions
Schedule a free consultation to discuss your Core Web Vitals challenges, or contact me to learn more about my technical SEO services.
Let's work together to pass Core Web Vitals and improve your search rankings.
Frequently Asked Questions About Core Web Vitals
What are Core Web Vitals and why do they matter for SEO?
Core Web Vitals are three Google ranking factors measuring user experience: LCP (loading speed), FID/INP (interactivity), and CLS (visual stability). They directly impact search rankings since June 2021. Pages with good Core Web Vitals receive ranking preference over slower competitors, making them essential for SEO success and user satisfaction.
How long does it take to see improvements after fixing Core Web Vitals?
Google uses 28 days of field data to calculate Core Web Vitals in Search Console. After implementing fixes, expect to see improvements reflected in Search Console reports within 28-35 days as new data replaces old measurements. Rankings may improve gradually over 2-3 months as Google re-evaluates your pages.
What's more important: mobile or desktop Core Web Vitals?
Mobile Core Web Vitals are more critical because Google uses mobile-first indexing, meaning they primarily evaluate your mobile experience for rankings. However, optimize both for comprehensive performance. Most sites should prioritize fixing mobile issues first, then address desktop performance.
Can Core Web Vitals affect conversions and revenue?
Yes, significantly. Studies show every 100ms improvement in LCP increases conversions by approximately 1%. Sites with good Core Web Vitals experience lower bounce rates, higher engagement, and better conversion rates. Improving CLS alone can reduce accidental clicks and user frustration that drives visitors away.
About the Author: I'm Sadekur Rahman, a Best SEO expert in Bangladesh with 4+ years of experience helping businesses improve Core Web Vitals and technical performance. I've successfully optimized 220+ websites across various industries, achieving good Core Web Vitals and improved search rankings. Explore my services or book a consultation to fix your Core Web Vitals issues.

Written by Sadekur Rahman
SEO & Website Strategy Specialist at Pixelvega and SEO Executive at Daily Amar Desh. 6+ years helping brands grow with data-driven SEO.